Latest Developments & Coming Soon
Evolution of A(H1N1)pdm09 Influenza - Click here for YouTube Movie
Link to Cluster Picking Tool
Link to Avian Influenza Maps
Published Research
Reassortments between influenza viruses in Swine
Estimating reassortment rates in co-circulating Eurasian swine influenza viruses
S. J. Lycett, G. Baillie, E. Coulter, S. Bhatt, P. Kellam, J. W. McCauley, J. L. N. Wood, I. H. Brown, O. G. Pybus & A. J. Leigh Brown ; for the Combating Swine Influenza Initiative (COSI) Consortium
J Gen Virol November 2012 vol. 93 no. Pt 11 2326-2336
Eurasian Swine PB2 Tree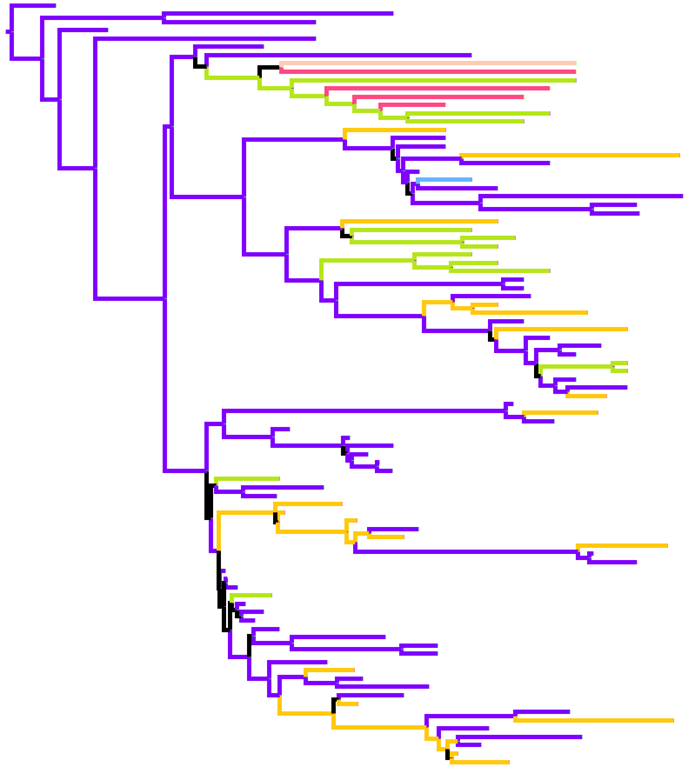
Eurasian Swine PB2 Tree coloured by HA and NA subtype. Time resolved maximum clade credibility tree generated by BEAST, coloured by subtype modelled as a discrete trait. |
Significant rates for reassortments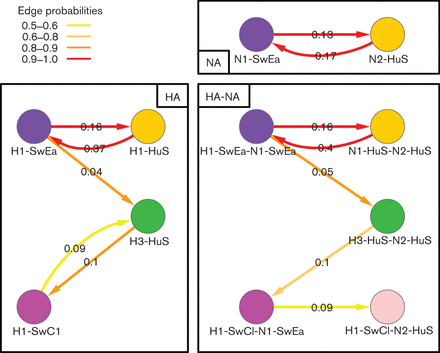
Significant rates for reassortments (expressed as exchanges per year) onto the PB2 backbone, calculated using beast discrete traits. HA only (left), NA only (top right) and HA-NA joint (bottom right) traits results are shown. Only those edges with a probability of existing in the trees sample =0.5 and Bayes factor =4 are shown, and the colour reflects the support for the edge ranging from red (strongest) to yellow (just significant). The edge values are median transition rates. Figure 4 |
H1N1v Pandemic Influenza in Scotland
Origin and Fate of A/H1N1 Influenza in Scotland during 2009
Samantha Lycett, Nigel J McLeish, Christopher Robertson, William Carman, Gregory Baillie,
James McMenamin, Andrew Rambaut, Peter Simmonds, Mark Woolhouse, Andrew J Leigh Brown
J Gen Virol June 2012 vol. 93 no. Pt 6 1253-1260
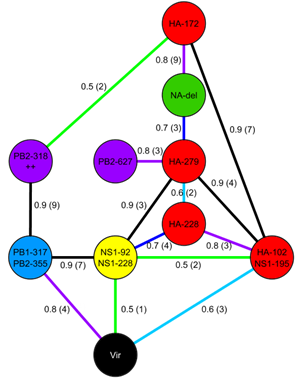
Figure 3 from Lycett et al. 2012 doi: 10.1099/vir.0.039370-0
Reassortments and the H1N1v Pandemic
Origins and evolutionary genomics of the 2009 swine-origin H1N1 influenza A epidemic
Smith GJD, Vijaykrishna D, Bahl J, Lycett SJ, Worobey M, Pybus OG, Ma SK, Cheung CL, Raghwani J, Bhatt S, Peiris JSM, Guan Y & Rambaut A Nature 459, 1122-1125 (25 June 2009) | doi:10.1038/nature08182
Figure 1 from Smith et al. 2009 doi:10.1038/nature018182
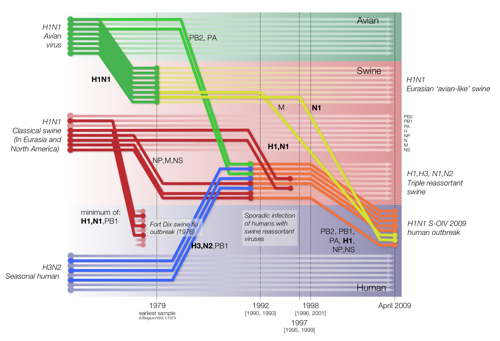 |
Reconstruction of the sequence of reassortment events leading up to the emergence of S-OIV. Shaded boxes represent host species; avian (green), swine (red) and human (grey). Coloured lines represent interspecies-transmission pathways of influenza genes. The eight genomic segments are represented as parallel lines in descending order of size. Dates marked with dashed vertical lines on ‘elbows’ indicate the mean time of divergence of the S-OIV genes from corresponding virus lineages. Reassortment events not involved with the emergence of human disease are omitted. Fort Dix refers to the last major outbreak of S-OIV in humans. The first triple-reassortant swine viruses were detected in 1998, but to improve clarity the origin of this lineage is placed earlier. Copyright S.J.Lycett and A.Rambaut. Published under the creative commons licence |
Influenza virulence
Detection of mammalian virulence determinants in highly pathogenic avian influenza H5N1 viruses: multivariate analysis of published data
Lycett S. J., Ward M. J., Lewis F. I., Poon A. F. Y., Kosakovsky Pond S. L., Leigh Brown A. J. (2009)
J. Virol.83(19):9901-9910 doi:10.1128/JVI.00608-09 -
Abstract -
Full Text
Figure 2 from Lycett et al. 2009 Copyright © American Society for Microbiology J. Virol. 83 (19):9901-9910 doi:10.1128/JVI.00608-09
